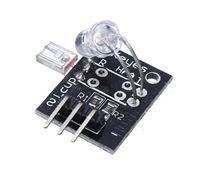
Galvanic Skin Response Grove GSR - Module
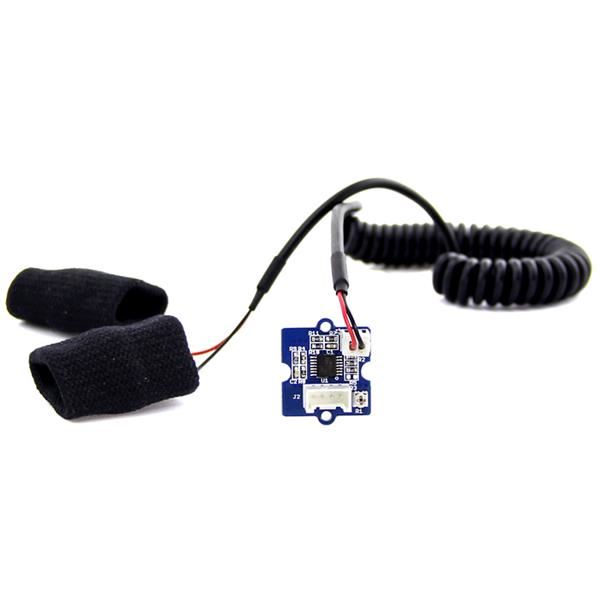
Description:
There are several graphs which are created in excel using GSR data.You can open the File:GSR sensor data.xls to see the detail data.
Copy and paste the code below to a new Arduino sketch and upload it to Arduino.
Wear the finger sheath and relaxNow open serial monitorwe can see:
Then take a deep breath. The buzzer should buzz now. And an obvious change in the output value should be observed.
The below is a graphs which is created in Excel using the data above. X axis represents time. and Y axis GSR data.
Features:
- Input Voltage: 5V/3.3V
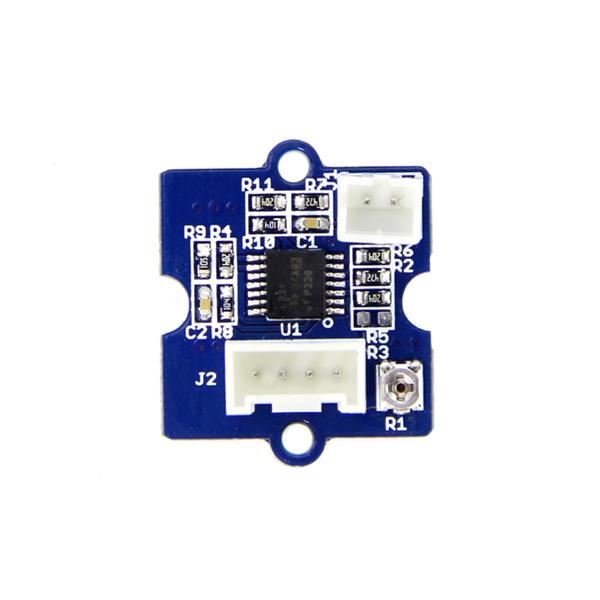
- Sensitivity adjustable via a potentiometer
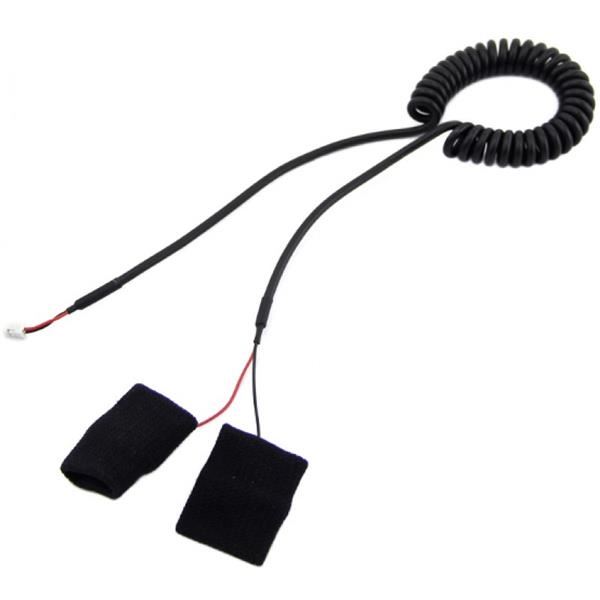
- External measuring finger cots
Mikroelectron Code:
const int BUZZER = 3;const int GSR = A2;int threshold = 0;int sensorValue;void setup(){ long sum = 0;Serial.begin(9600);pinMode(BUZZEROUTPUT);digitalWrite(BUZZERLOW);delay(1000);for (int i = 0; i < 500; i++){sensorValue = analogRead(GSR);sum += sensorValue;delay(5);}threshold = sum / 500;Serial.print("threshold =");Serial.println(threshold);}void loop(){ int temp;sensorValue = analogRead(GSR);Serial.print("sensorValue=");Serial.println(sensorValue);temp = threshold - sensorValue;if (abs(temp) > 50){sensorValue = analogRead(GSR);temp = threshold - sensorValue;if (abs(temp) > 50){digitalWrite(BUZZERHIGH);Serial.println("YES!");delay(3000);digitalWrite(BUZZERLOW);delay(1000);}}}
Related Products
subscribe to our weekly newsletter


